The half-life of an AI claim
August 2026
Abstract
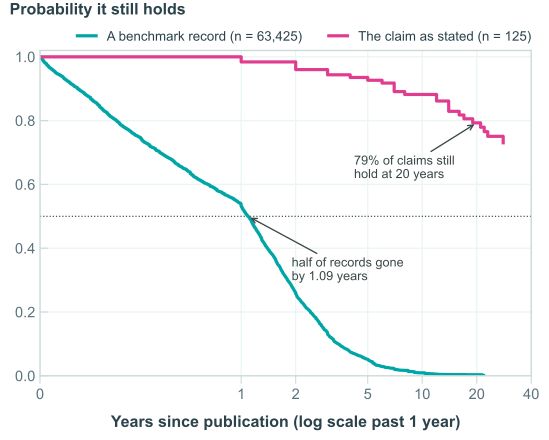
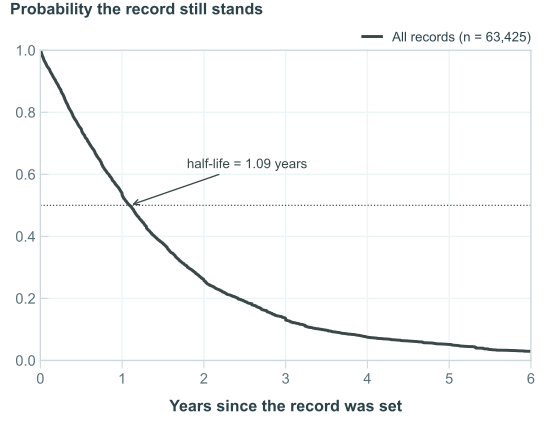
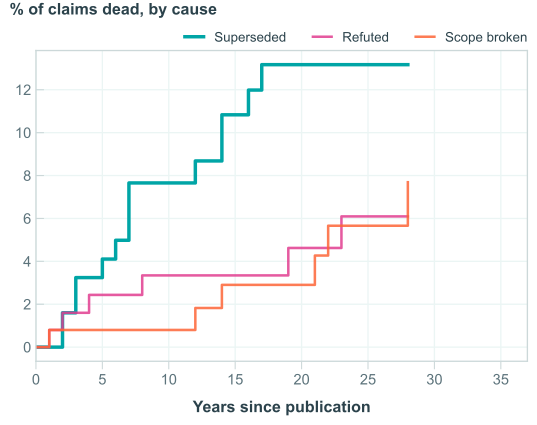
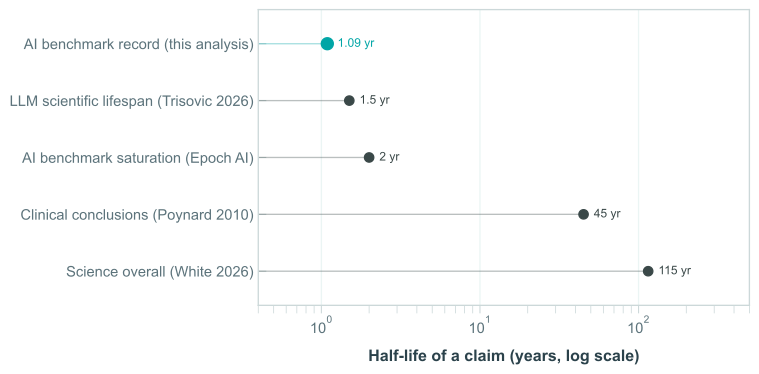
Machine learning results are widely believed to go stale faster than results in any other field. How much faster has not been measured. A recent analysis of claim lifetimes across science reports a half-life of 115 years [1]A. White. the half-life of science. diffuse.one/p/d1-012, August 4, 2026., but of its 3,444 claims only 32 are computer science, they come from two papers (a 1999 clustering survey [15]A. K. Jain, M. N. Murty, P. J. Flynn. Data clustering: a review. ACM Computing Surveys 31(3), 1999. Source of 25 of the 32 computer-science claims in White's sample. and a 2014 brain-tumour segmentation paper), and none of them died. We measure it for AI, and find that AI does not have one claim half-life. It has two, and they differ by more than an order of magnitude. A state-of-the-art record, the assertion that some method is the best on a benchmark, has a half-life of 1.09 years across 63,425 records with 47,533 observed deaths. A claim as literally stated in the same literature is still true 79% of the time after twenty years, measured on 125 claims from a year-stratified sample of NeurIPS papers going back to 1987. The gap is composition: 59 of those 125 claims are mathematical, and one has died in up to 37 years. Decomposing deaths by cause shows why the two numbers diverge. Supersession outruns refutation by roughly three to one, among empirical claims and overall, which is also why a rubric that counts only corrections reports AI as slower than medicine. We take this as compelling evidence that “how fast does AI move” is underspecified as posed, and that any answer must say which kind of claim it means.
1 Introduction
How fast a field advances is hard to measure. Counting papers rewards volume, counting funding rewards inefficiency, and citation counts measure attention rather than knowledge. One recent proposal is to measure it directly: take claims from the literature, record when each one is overturned, and estimate a survival curve [1]A. White. the half-life of science. diffuse.one/p/d1-012, August 4, 2026. Samples claims from 151 review papers and adjudicates them with a literature-search agent.. Applied across physical and life sciences this gives a half-life of 115 years, with claims from the 2000s dying faster than claims from the 1950s.
The method uses
Our main claim is that AI has two claim half-lives rather than one, and that they differ by more than an order of magnitude. A state-of-the-art record has a half-life of 1.09 years. A claim as literally stated in the same literature is still true 79% of the time at twenty years, and its survival curve never reaches one half anywhere in a 39-year window. Both quantities are real and they answer different questions. The first says how long a result stays the best; the second says how long a sentence stays true.
Our case rests on two datasets built to see different things. The first is mechanical: every state-of-the-art record on every Papers-with-Code leaderboard, where a record is born when a paper takes the top score and dies the day another paper beats it. This gives exact dates, 63,425 records and no human judgment. The second is adjudicated: 125 claims extracted from two papers sampled from every NeurIPS proceedings from 1987 to 2024, each coded for what kind of claim it is and whether it still holds. This covers the years before leaderboards existed and the ways of dying that leaderboards cannot see.
The explanation for the gap is composition, and it is the part we think generalises. AI's literature is roughly half mathematical, and mathematical claims do not decay: 59 of our 125 claims are theorems or analyses, and exactly one has died. Pooling them with empirical claims produces a number that describes neither population. This matters beyond bookkeeping, because it means a rubric calibrated on fields where claims die by correction will systematically misread AI. Applied unmodified, such a rubric reports AI as slower than medicine.
The practical implication is for anyone citing an AI result as current evidence. If the claim is that a method is best, it has a roughly even chance of being stale within a year. If the claim is a mathematical property, staleness is close to a non-issue. These are different risks and they should not be managed with the same discount.
Contributions.
- A survival measurement of ML results at scale: 63,425 state-of-the-art records with 47,533 observed deaths, giving a half-life of 1.09 years, stable in the range 0.67–1.20 years across every specification we tried (§3).
- A measurement of claim durability spanning the pre-deep-learning era: 125 claims from NeurIPS 1987–2024, showing a separation by claim type that is significant at \(p < 0.0001\) (§4).
- A decomposition of claim death into three causes, estimated as competing risks, showing supersession runs about three times ahead of refutation (§5).
- Two corrections to the survival-analysis method that apply to the original analysis as well as ours, one of which reverses the sign of the measured trend (§6).
2 What it means for a claim to die
The original rubric scores a claim as overturned or modified only when a later paper corrects it, and requires a verified correcting DOI as evidence. It states explicitly that “field advancement beyond the claim's scope does not constitute modification.” That rule is well matched to fields where being wrong is the main way a claim leaves the literature. It is not well matched to AI, where the common case is that a claim stays true and stops mattering.
We therefore separate three ways a claim can die. Keeping them apart is what makes the two half-lives comparable at all.
| Cause | Definition | Example from our sample |
|---|---|---|
| Refuted | Later work shows the claim was wrong. | “On a larger vocabulary task, neural net classifiers did not reduce the error rate” (1989), overturned in 2012 by deep acoustic models [7]G. Hinton et al. Deep Neural Networks for Acoustic Modeling in Speech Recognition. IEEE Signal Processing Magazine 29(6), 82–97, 2012.. |
| Superseded | The claim is still true but is no longer the answer, because a better result replaced it. | ResNet-152 held the ImageNet top-1 record at 78.57%. It is still true that it reached 78.57%. It stopped being the best after 75 days. |
| Scope-broken | The claim holds only in the regime it was stated for, and that regime stopped being the relevant one. | “Cross-validation and Akaike's FPE select an optimal network architecture” (1991), which fails for overparameterised networks [8]M. Belkin, D. Hsu, S. Ma, S. Mandal. Reconciling modern machine-learning practice and the classical bias-variance trade-off. PNAS 116(32), 2019.. |
Because only the first of these to occur is observed, we estimate them as
3 Records die in about a year
Two things this number is not. First, the estimand is closer to contested-ness than to progress. Splitting benchmarks into quartiles by how many records they ever accumulated, the record half-life runs 1.92 years on the least contested quartile, then 1.21, 0.86, and 0.57 on the most contested, a 3.4-fold span wider than any trend over time reported below. The pooled 1.09 years is a mixture over those strata, so it describes the composition of this archive as much as it describes AI. If five times as many people attack a benchmark, records fall faster with no change in progress per researcher.
An earlier version of this section argued the same point from a correlation between the death rate and a count of competing records set within the year. That argument was circular and has been withdrawn: a record dies exactly when the next record on its leaderboard is born, so the predictor was the outcome. Of 60,230 records with a full year of observation, no record died without a competing record appearing, and the two agree 99.2% of the time. The stratification above is a description, not a causal decomposition, and we do not claim to separate crowding from calendar time. Second, collapsing same-day entries to the best one discards 25.8% of all entries and removes the shortest possible lifetimes, which biases the estimate upward. We did this so a record beaten on its publication date is not counted as holding for zero days, but it is an intervention on the dependent variable, and in that respect 1.09 years is an upper bound.
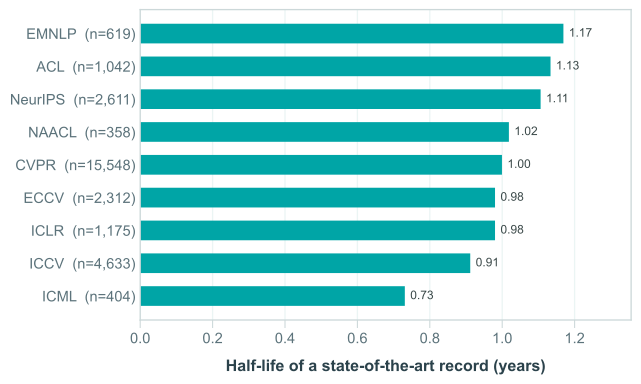
Splitting by publication venue shows the effect is not confined to one community, and gives a result we did not expect. Records first published at a flagship conference die faster than records that only ever appeared on arXiv: 1.00 years against 1.21, log-rank \(\chi^2 = 479\), \(p = 3.4 \times 10^{-106}\). We think the likely explanation is selection rather than causation, since flagship papers target the most contested benchmarks, but we did not design a test that separates the two.
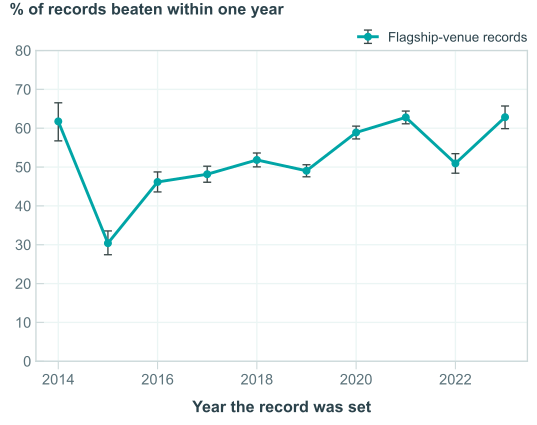
Turnover has increased over time, though by less than the framing of an “acceleration” suggests. Rather than fit half-lives to cohorts whose follow-up is shorter than the quantity being estimated, we ask a question the data can answer directly: of records set in year \(Y\) on benchmarks demonstrably still under attack in \(Y{+}1\), what fraction were beaten by \(Y{+}1\)? For flagship venues that runs from 0.462 in 2016 to 0.628 in 2023.
4 The claims themselves do not
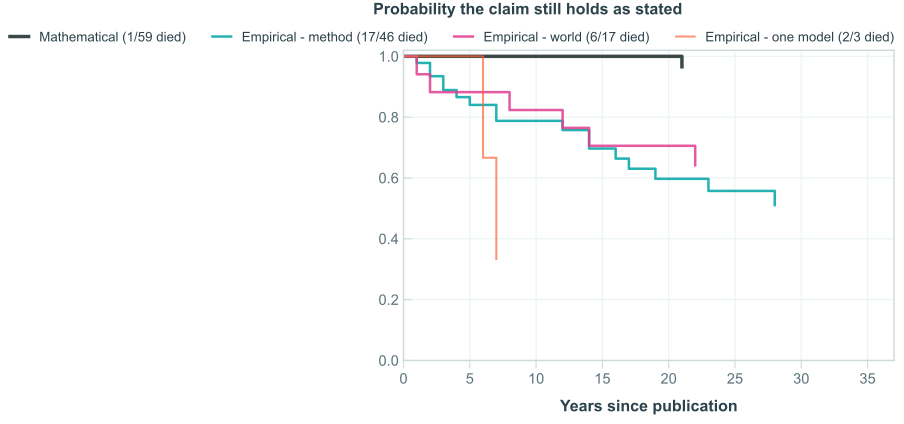
We flag one interpretation the figure does not support. The flat mathematical curve is not evidence that AI theory is unusually reliable, and it is not a claim about replication. It says only that theorems, once proved, stop being the kind of thing that a later empirical result can overturn. The interesting quantity for a theorem is whether it remains relevant, which this method does not measure.
5 Why the standard rubric fails here
6 Limitations
Two corrections to the method came out of red-teaming our own first result, and both apply to the original analysis as much as to ours. We state them first because the second one reversed the sign of what we measured.
- Follow-up truncation. In the original decade breakdown, the 2000s cohort has at most twenty-five years of observation and is assigned a seventy-year half-life, and the projected singularity date is a regression on those extrapolations. AI is the rare case where this is avoidable, because the events happen inside the observation window. Every cohort comparison here uses a fixed one-year horizon, and implied half-lives are reported as derived quantities.
- Collection decay. Papers-with-Code was shut down abruptly in late July 2025 and its domain redirected away, and submissions were crowd-sourced with a lag even before that, so successors to recent records are under-recorded and a record can look durable because nobody wrote its successor down. Requiring the leaderboard to show activity beyond the horizon moves the 2023 one-year death rate across all records from 0.461 to 0.600. (The 0.628 quoted in §3 is the flagship-venue subset under the same correction, not a third estimate of the same quantity.) Read naively, the uncorrected data says turnover has been slowing since 2021. This correction was post-hoc: we found the artifact while checking why the trend reversed, and then designed the activity condition to remove it.
The general form of the second point is worth separating out, because it will affect anyone running this kind of analysis on a crowd-maintained resource. A dataset that stops being maintained does not present itself as incomplete. It presents itself as a field where nothing is happening.
Remaining limitations, roughly in order of how much they should worry a reader:
- Single-annotator adjudication. Claim 2 and Claim 3 rest on 125 claims
coded by one annotator, an LLM, with no second rater and no measured agreement.
What we did about it
Each claim carries a confidence level and a one-line rationale, so a specific disagreement can be located rather than argued in the abstract, but that table is not currently posted, so the caveat is only partly mitigated. Claim 1, the headline number, does not depend on this layer at all. We would treat the exact survival percentages in §4 as indicative and the type separation as robust, since it would take roughly fifteen reclassifications in one direction to remove it. - The adjudicated sample is NeurIPS-only. The historical arm covers one
venue, so community-specific effects are not separable from era effects.
What we did about it
We intended a ten-venue sample and were rate-limited while collecting it. NeurIPS is the only flagship venue running unbroken from 1987, so it is the right single choice for the era stratification, but a replication across ACL and CVPR would be the obvious next step. Claim 1 does cover ten venues. - Leaderboard coverage is uneven. Papers-with-Code is denser in vision than
in theory, and venue labels resolve for only 45% of records.
What we did about it
The half-life ranges from 0.93 to 1.16 years across the twelve largest task families, and removing the largest changes the pooled estimate by 0.003 years. Coverage badly under-counts ICML (n = 404) and AAAI (n = 86), so we report the aggregate flagship comparison with more confidence than the per-venue ordering in Figure 3. - A record is not the same object as a claim. Claim 1 measures leaderboard
positions, which is a narrower thing than what a paper asserts.
What we did about it
This is why Claim 2 exists as a separate measurement rather than a robustness check on Claim 1. We would resist any reading that collapses the two, which is the substance of the whole post. - Statistical strength is uneven across our claims.
What we did about it
The venue comparison (\(p \approx 10^{-106}\)) and the claim-type separation (\(p < 0.0001\)) clear the threshold we would want for an exploratory analysis. The cohort trend in Figure 4 does not: it is ten points with a non-monotone dip, and we describe it as a rise of about a third rather than fitting anything to it.
7 Related work
The method is taken directly from White [1]A. White. the half-life of science. diffuse.one/p/d1-012, 2026., which in turn follows a line of truth-survival analyses in clinical research [3]T. Poynard et al. Hirsch index and truth survival in clinical research. PLoS ONE 5(8): e12044, 2010.. Our contribution is not the method but its transfer: the cause decomposition in §2 and the two corrections in §6 are new, and are what make the transfer possible.
For AI specifically, the closest work measures adjacent quantities. Trišović [6]A. Trišović. The Shrinking Lifespan of LLMs in Science. arXiv:2604.07530, 2026. 62 models, 108k citing papers. tracks how long a language model stays in scientific use, finding lifespan shrinks 23% per release year; that measures the tool, not the claim. Iacono [10]C. Iacono. The Half-Lives of Generative-AI Evidence. arXiv:2607.24032, 2026. audits 40 generative-AI papers, finds the newest model named is a median 281 days old at publication, and states explicitly that no decay rate is estimated; our Claim 1 supplies a rate for a related quantity. A separate line of work shows that individual SOTA claims are often fragile even at the moment they are made [11]Position: State-of-the-Art Claims Require State-of-the-Art Evidence. arXiv:2605.17273, 2026. Across ten leaderboards, more than half of top-model comparisons fail at least one property that superiority implies., and that reported improvements sometimes do not survive re-implementation [12]M. F. Dacrema, P. Cremonesi, D. Jannach. Are We Really Making Much Progress? RecSys 2019. 7 of 18 methods reproduced; 6 of those 7 beaten by tuned baselines.. Those papers ask whether a record was ever real; we ask how long it lasted.
On the specific question of whether computing obsolesces faster than other fields, the bibliometric evidence has gone both ways. Sjøberg [13]D. I. K. Sjøberg. Confronting the myth of rapid obsolescence in computing research. CACM 53(9), 62–67, 2010. found in 2010 that computing's cited half-life was no shorter than other disciplines. The citation-age compression reported since [5]H. N. Nguyen and S. Eger. Is there really a Citation Age Bias in NLP? arXiv:2401.03545, 2024. is recent and concentrated in AI subfields.
Methods
Records. From the Papers-with-Code evaluation-table archive, snapshot 2025-07-28. For each (task, dataset, metric) leaderboard we collapse entries to the best value per publication date, so a record beaten on the day it appeared is never counted, then take the running best to define a chain of records with exact birth and death dates. Metric optimisation direction is assigned by pattern; ambiguous names and resource metrics are dropped rather than guessed. We validated that classifier against a signal never used to build it, the observed drift in mean reported score over time, on the 565 leaderboards with at least 40 entries: it agrees in 95% of cases. Standing records are right-censored at the leaderboard's last observed activity plus a one-year grace period, capped at the snapshot date; varying the grace period from zero to ten years moves the pooled half-life between 0.88 and 1.12 years.
Claims. Two papers sampled per year from every NeurIPS proceedings, 1987–2024, giving 75 papers after dropping those without a recoverable abstract. Claims were extracted from abstracts and coded SURVIVED, SUPERSEDED, SCOPE_BROKEN or REFUTED as of 2026, with a type label and a confidence level. Extracting from abstracts rather than full text biases the sample toward headline claims and toward statements about what the field cannot yet do; a full-text extraction would likely find more ordinary empirical reversals.
Statistics. Kaplan-Meier with Greenwood variance and log-log confidence bands, the log-rank test, and cumulative incidence for competing risks are implemented directly rather than imported, and checked against the Freireich 6-mercaptopurine leukaemia remission data [14]E. J. Freireich et al. The effect of 6-mercaptopurine on the duration of steroid-induced remissions in acute leukemia. Blood 21(6), 699–716, 1963., whose estimates are tabulated in every survival analysis text: S(6)=0.857, S(7)=0.807, S(10)=0.753, S(13)=0.690, S(16)=0.627, S(22)=0.538, S(23)=0.448, median 23. All reproduce. The record-chain logic is checked against hand-computed synthetic leaderboards covering ties, same-day publication and lower-is-better metrics.
Reproducibility. The analysis runs from two public archive files, both named above, and the record table is mechanically reproducible from them with the pipeline described here. Code and the adjudicated claim table, with type, status, annotator confidence and the one-line rationale behind each coding, are available on request.
References
- A. White. the half-life of science. diffuse.one/p/d1-012, August 4, 2026.
- E. L. Kaplan, P. Meier. Nonparametric estimation from incomplete observations. Journal of the American Statistical Association 53(282), 457–481, 1958.
- T. Poynard, et al. Hirsch index and truth survival in clinical research. PLoS ONE 5(8): e12044, 2010.
- Epoch AI. A Rosetta Stone for AI benchmarks and Epoch Capabilities Index. 2025–2026.
- H. N. Nguyen, S. Eger. Is there really a Citation Age Bias in NLP? arXiv:2401.03545, 2024.
- A. Trišović. The Shrinking Lifespan of LLMs in Science. arXiv:2604.07530, 2026.
- G. Hinton, L. Deng, D. Yu, et al. Deep Neural Networks for Acoustic Modeling in Speech Recognition. IEEE Signal Processing Magazine 29(6), 82–97, 2012.
- M. Belkin, D. Hsu, S. Ma, S. Mandal. Reconciling modern machine-learning practice and the classical bias-variance trade-off. PNAS 116(32), 2019.
- Papers with Code. Evaluation tables archive. Snapshot 2025-07-28, huggingface.co/datasets/pwc-archive/files.
- C. Iacono. The Half-Lives of Generative-AI Evidence. arXiv:2607.24032, 2026.
- Position: State-of-the-Art Claims Require State-of-the-Art Evidence. arXiv:2605.17273, 2026.
- M. F. Dacrema, P. Cremonesi, D. Jannach. Are We Really Making Much Progress? A Worrying Analysis of Recent Neural Recommendation Approaches. RecSys 2019. arXiv:1907.06902.
- D. I. K. Sjøberg. Confronting the myth of rapid obsolescence in computing research. Communications of the ACM 53(9), 62–67, 2010.
- E. J. Freireich, et al. The effect of 6-mercaptopurine on the duration of steroid-induced remissions in acute leukemia. Blood 21(6), 699–716, 1963.
- A. K. Jain, M. N. Murty, P. J. Flynn. Data clustering: a review. ACM Computing Surveys 31(3), 264–323, 1999.