Evidence audit · Venture capital
When scale creates value
The economics of growth, and what the evidence says about venture capital’s incentives
Abstract
Growing a company and building a valuable business are different accomplishments. Aswath Damodaran’s critique of scale-first venture capital makes that distinction clearly. Its empirical argument is less secure. We audit the article’s sources and find three consequential shifts in meaning: company exit value becomes investor return; a pooled fund index becomes the median investor; and short-term price reversal becomes a test of fundamental valuation. Public data also contradict the claimed eleven-year increase in recent IPO age. These corrections leave a useful, narrower argument: financing expands a company’s choices, while contracts and operating economics determine whether expansion is worthwhile. We turn that argument into a decision framework based on incremental cash flows, observable customer behavior, and survival under a downside case. This is an evidence synthesis, not a new causal study.
Research cutoff: September 5, 2026. Based on the completed OpenResearch audit of Damodaran’s original essay. Source dates and statistical samples vary; 2026 is incomplete.
1 The decision beneath the debate
A startup can become larger while becoming less valuable. It can also become more valuable while reporting a loss. The difference lies in what the next increment of spending buys: durable customer contribution, temporary demand, reusable capacity, or a recurring obligation.
Damodaran argues that venture capital can reward the visible achievement of scale before the harder work of establishing profitability. His strongest contribution is the operating distinction. A large market permits expansion; it does not guarantee attractive margins, defensible pricing, or efficient capital use. [1]
Yet current profit is an imperfect referee. Acquisition and research costs can arrive before the benefits they create. Conversely, a positive operating margin can conceal expensive replacement assets or cash tied up in inventory. Financing cash can extend a company’s life without showing that its operations sustain it. The relevant question is whether a particular expansion improves expected future cash flows enough to justify the resources committed. [14]
Proposition 1 Conditional
Scale creates value when the expected incremental cash flows justify the incremental investment, relative to a credible alternative.
That alternative matters. Waiting may preserve cash and reveal demand, but it may also surrender a distribution advantage. Shrinking may release resources, but an accounting loss alone does not justify abandoning sunk capacity. Neither maximizing revenue nor maximizing this quarter’s profit answers the decision.
2 What the 80% measures
The article’s most striking statistic says the top 1% generated 80% of venture returns in 2023–2026. The source measures something different: gross company exit value. CF Private Equity, using PitchBook, reports an 80% share for the top 1% of companies and 45% after excluding SpaceX. Its window ends June 18, 2026. [2]
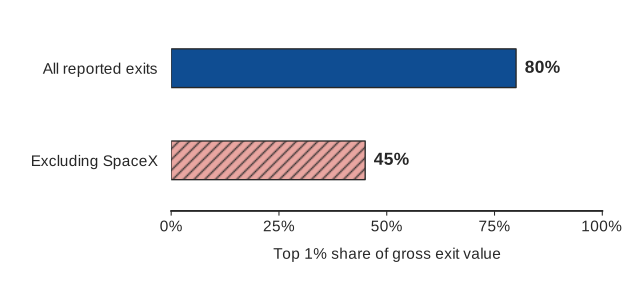
A company’s exit valuation does not tell us what its investors earned. That requires entry price, ownership, dilution, contractual preferences, and timing. Fund performance adds failed investments, fees, carry, and residual holdings. An enormous exit can therefore coexist with very different outcomes for different investors.
A second distinction concerns the “median VC.” Cambridge Associates reports a capitalization-weighted, pooled horizon internal rate of return, net of fees and carry. Its public-market comparisons use a cash-flow-matched benchmark. This is a meaningful aggregate, but it is not the median fund or manager, and its relative performance varies across horizons. [3]
Finding 1 Metric correction
Concentrated exit value establishes the importance of a few large transactions. It does not identify who captured the returns, or prove that most investors adopted a destructive growth strategy.
Even a heavily skewed distribution does not determine exactly what fraction beats its mean. The claim that only about a quarter of VCs do so needs an observed population and a specified return measure. A power-law description alone cannot supply that percentage.
3 Incentives, without inevitability
The incentive concern survives these corrections. A diversified fund can pursue a small probability of an exceptional outcome while a founder bears concentrated career and ownership risk. Fund life, follow-on reserves, valuation-based compensation, and secondary liquidity can also change the preferred timetable. These are plausible mechanisms, not evidence that every investor pushes every company toward maximum scale.
There is meaningful counterevidence to that universal account. A survey of 885 institutional venture capitalists reports recruiting, strategic guidance, and customer introductions alongside deal selection. Self-report cannot establish the size of the benefit, but it contradicts a picture of investors who only compare prices. Contracting research also documents control and cash-flow rights tailored to perceived risks. [4] [5] A broader review nevertheless identifies constraints on the innovations VC funds and concerns about relaxed governance. [6]
The strongest evidence concerns access to financing. Kwon, Lowry, and Qian associate mutual-fund participation with longer private lives, with instrumental-variable estimates supporting a financing channel. Ewens and Farre-Mensa use regulatory change to study expanded private capital, later listings, and greater founder bargaining power. [7] [8]
Those studies support a change in the feasible growth path. They do not establish that the additional private years produce worse unit economics. Staying private could fund patient development, postpone scrutiny, or do both. Moving from financing to listing delay is a smaller inferential step than moving from listing delay to economic harm.
4 Two different market signals
Another part of the essay argues that weakening reversal leaves public prices less constrained by fundamentals. But the cited French series is short-term reversal: it sorts stocks using their previous month’s return. The momentum portfolios use returns from months two through twelve. Neither construction directly compares price with estimated business value. [9]
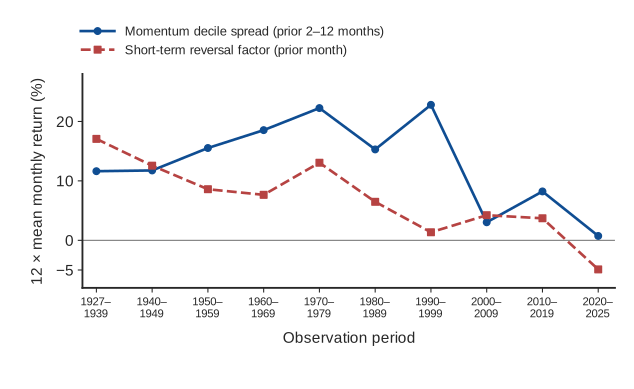
The distinction changes the interpretation. A weaker one-month contrarian return is not proof that fundamental information has stopped influencing prices. It also does not establish that passive funds caused that change or that founders responded by neglecting profitability.
Passive ownership has several possible effects. It can alter demand for securities while still exercising voting power. Appel, Gormley, and Keim find governance changes associated with passive ownership using index-assignment variation. [15] That does not settle every price-efficiency question; it makes a single story about passive investors too coarse.
5 Older, but by how much?
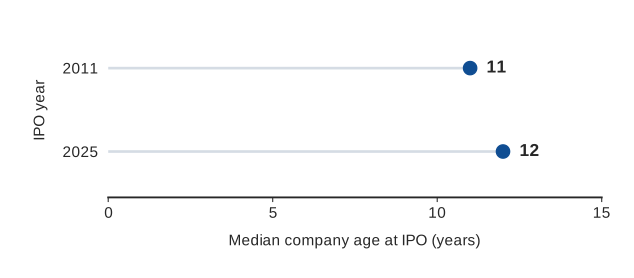
Ritter’s IPO tables broadly support a historical shift toward older companies, larger real revenues, and less frequent profitability relative to the 1980s. One specific claim fails, however: the median company did not become eleven years older over the recent fifteen-year interval. In the all-IPO age table, the median is 11 years in 2011 and 12 in 2025. [10]
Composition matters elsewhere too. Averaging yearly median revenues does not produce the median revenue of all companies in those years. The proportion profitable changes with the interval, weighting, and industry mix. Biotechnology and businesses with substantial expensed research need not follow the same earnings timetable as mature industrial firms.
These are not reasons to dismiss the historical changes. They are reasons to avoid converting them directly into a causal verdict on venture capital. The relevant comparison would follow otherwise comparable companies facing different financing or growth incentives, including firms that never reach an IPO.
6 A decision rule for founders
Company examples make the mechanisms tangible. Amazon’s 1997 letter coupled ambitious growth with repeat-customer evidence, return testing, and a willingness to terminate unsuccessful programs. [11] WeWork’s 2022 filing disclosed a very different exposure: long property obligations supporting much shorter customer commitments. [12] Ferrari’s 2025 results paired 13,640 shipments with a 29.5% operating margin, illustrating the viability of deliberate volume restraint. [13] These selected cases illustrate possibilities; they do not estimate success rates.
Start with a customer cohort, location, product, or capacity block that can be evaluated independently. Compare expansion with waiting or another feasible use of resources. A conventional enterprise cash-flow calculation provides a useful discipline:
+ ΔD&At − ΔCapext − ΔNWCt
FCFF is free cash flow to the firm; EBIT is operating profit; Tax denotes operating cash taxes; D&A is depreciation and amortization; Capex includes maintenance and growth investment; NWC is operating working capital. Δ compares the expansion with its counterfactual. Taxes must reflect loss carryforwards and timing.
Discount expected incremental cash flows, including the initial outlay, at a risk-consistent cost of capital. Add a terminal residual only if justified, including remaining investment needs or liquidation recoveries. Count acquisition costs once. Represent execution uncertainty consistently in scenarios and the discount rate; do not add a second blanket risk deduction. A possible future market is not a separate option asset without a defensible mechanism and price.
Keep financing feasibility alongside valuation. A positive expected value cannot pay next month’s payroll. Stress cash balances, working-capital peaks, leases, and debt maturities without assuming the next round arrives at a higher valuation. Equity ownership, preferences, and dilution then determine how enterprise value is shared.
| Decision | Evidence required | Capital commitment |
|---|---|---|
| Accelerate | Repeatable customer economics; positive expected value; survivable downside. | Expand validated cohorts or capacity. |
| Stage | Promising economics with unresolved demand, capacity, or competitive risk. | Release funding against observable milestones. |
| Experiment | Important assumptions remain untested; a small test can resolve them. | Buy useful information with bounded exposure. |
| Hold or exit | Expansion loses value relative to waiting, redesign, or closure. | Choose the best forward-looking alternative. |
Before funding, write down retention, realized price, fully loaded service cost, acquisition payback, capacity utilization, and stop dates. Compare new cohorts with validated ones. A blended margin can improve while the newest customers become progressively more expensive to acquire and serve.
Proposition 2 Decision rule
Commit capital when operating evidence supports the next increment of growth. Commit in stages when the next increment mainly buys information.
7 What remains open
Damodaran identifies a real possibility: abundant financing can preserve and enlarge a weak business. The evidence reviewed here does not tell us how often it happens, whether it is becoming more common, or its net social cost.
Answering that requires linked financing terms, ownership histories, operating cohorts, failures, and eventual cash distributions. Public winners are a selected sample. PitchBook exit microdata and Cambridge fund cash flows were unavailable; proprietary summaries cannot recover those missing counterfactuals. The original Khosla conversation was also not recovered, so this article makes no inference about his intent.
The practical conclusion is conditional but actionable. Keep the distinction between growth and value. Keep the distinction between available capital and good economics. Then make the disagreement testable: specify what the next investment should change, when that change should appear, and what happens if it does not.
Methods & materials
This article synthesizes the completed OpenResearch project Scaling vs Profitability — VC Evidence Audit. Literature discovery used OpenAlex and alphaXiv, followed by source checks against research papers, issuer filings, and dataset documentation. The accompanying audit records 31 claim-level assessments. We distinguish source-reported facts, reproducible public-data transformations, and causal interpretations.
Figure 1 redraws two vendor-reported percentages. Figure 2 uses archived French monthly series, subtracts the low-return decile from the high-return decile, and multiplies each period’s mean monthly return by twelve. This is an arithmetic annualization, not a compound growth rate or an implementable return net of costs. Figure 3 uses two published cohort medians. Figure production adapts Chen Liu’s figures4papers; the downloadable package contains the figure materials. Historical dataset revisions and the original essay’s undisclosed transformations limit exact replication.
References
- Aswath Damodaran. The Scaling and Profitability Trade off: Venture Capital’s Weakest Link! September 2026. Original essay examined here.
- Aaron Miller, CF Private Equity. AI is Steepening the Power Law in Venture Capital. July 13, 2026. PitchBook-based exit-value statistics; cutoff June 18, 2026.
- Cambridge Associates. US PE/VC Benchmark Commentary: Calendar Year 2025. July 31, 2026. Pooled-return methodology and cash-flow-matched public benchmarks.
- Paul Gompers, Will Gornall, Steven N. Kaplan, and Ilya A. Strebulaev. How Do Venture Capitalists Make Decisions? Journal of Financial Economics, 2020. Survey of 885 institutional VCs.
- Steven N. Kaplan and Per Strömberg. Characteristics, Contracts, and Actions: Evidence from Venture Capitalist Analyses. Journal of Finance, 2004; linked working paper, 2002.
- Josh Lerner and Ramana Nanda. Venture Capital’s Role in Financing Innovation: What We Know and How Much We Still Need to Learn. Journal of Economic Perspectives, 2020.
- Sungjoung Kwon, Michelle Lowry, and Yiming Qian. Mutual Fund Investments in Private Firms. Journal of Financial Economics, 2020. Authors’ research summary.
- Michael Ewens and Joan Farre-Mensa. The Deregulation of the Private Equity Markets and the Decline in IPOs. Review of Financial Studies, 2020.
- Kenneth R. French. Data Library. Short-term reversal construction. Public series retrieved September 5, 2026; complete annual coverage through 2025 used here.
- Jay R. Ritter. IPO Data. Age of Companies Going Public, Table 4. Sales and earnings tables. Archived public summaries through 2025.
- Amazon. 1997 Letter to Shareholders. Reproduced in an SEC filing.
- WeWork. 2022 Form 10-K. Lease commitments and membership terms.
- Ferrari. FY 2025 Results. February 10, 2026. Shipments and operating margin.
- U.S. Securities and Exchange Commission. Beginners’ Guide to Financial Statements. Operating, investing, and financing cash-flow distinctions.
- Ian R. Appel, Todd A. Gormley, and Donald B. Keim. Passive Investors, Not Passive Owners. Journal of Financial Economics, 2016.